
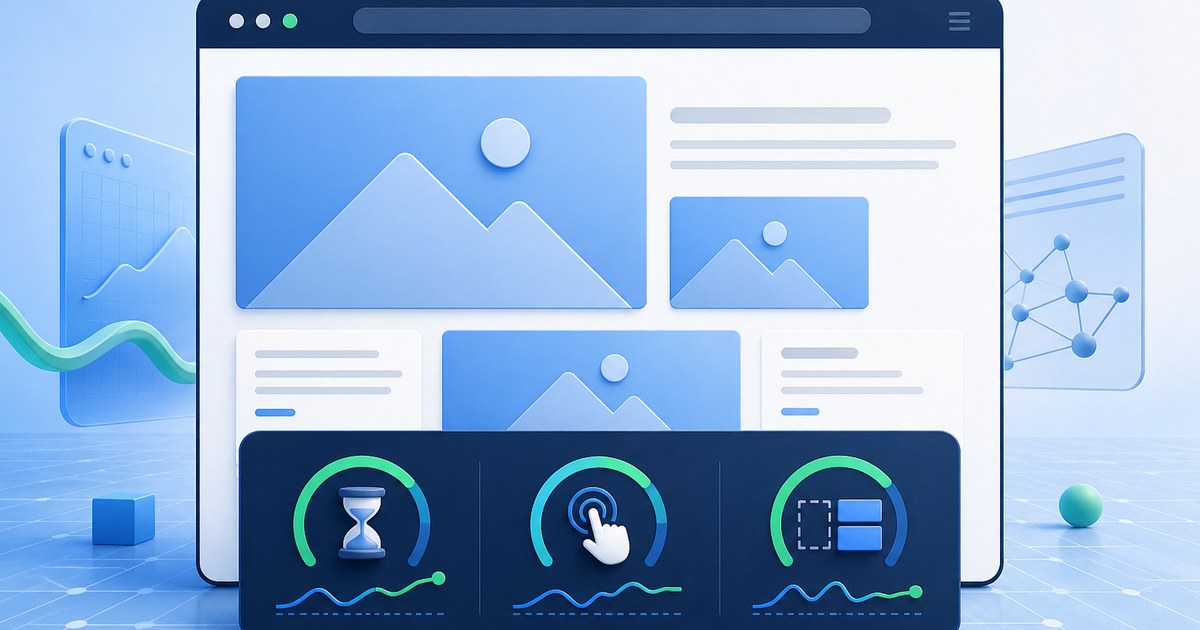

Image-heavy pages and browser-based media tools have two different performance stories. The first is what a visitor experiences while the page loads and responds. The second is how long an image operation—such as decoding WebP or exporting PNG—takes after the visitor selects a file. Core Web Vitals measure the first story. They do not, by themselves, benchmark the second.
The short version
- LCP measures when the largest visible content element is rendered. Aim for 2.5 seconds or less.
- INP measures interaction responsiveness across a visit. Aim for 200 milliseconds or less.
- CLS measures unexpected visual movement. Aim for 0.1 or less.
- Evaluate each metric at the 75th percentile, separately for mobile and desktop field data.
- Use CrUX or Search Console for real-user evidence; use Lighthouse and DevTools to reproduce and diagnose problems.
- Do not present server-side, Python or library conversion timings as browser Core Web Vitals.
The current Core Web Vitals
Google’s current stable Core Web Vitals are Largest Contentful Paint (LCP), Interaction to Next Paint (INP) and Cumulative Layout Shift (CLS). INP replaced First Input Delay (FID); FID is no longer a current Core Web Vital. Google defines “good” thresholds using the 75th percentile of page visits, not the best run or the average run. The thresholds are the same on mobile and desktop, although the data should still be inspected separately because device and network conditions differ.
| Metric | What it represents | Good | Poor |
|---|---|---|---|
| LCP | Loading performance of the largest visible content element | ≤ 2.5 s | > 4.0 s |
| INP | Responsiveness to clicks, taps and keyboard interactions | ≤ 200 ms | > 500 ms |
| CLS | Unexpected visual instability | ≤ 0.1 | > 0.25 |
These are experience categories, not guarantees about ranking, sales or conversion rate. Google includes Core Web Vitals within its broader page-experience systems, but it also says that strong page experience does not override relevance. Treat performance as a user-experience requirement and a technical quality signal—not as a promise of a particular search position.
Field data and lab data answer different questions
Field data: what real visitors experienced
The Chrome User Experience Report (CrUX) aggregates eligible Chrome users’ real-world experiences. PageSpeed Insights can display CrUX data, and Search Console groups URLs with similar performance characteristics in its Core Web Vitals report. Field data includes actual devices, networks, caches, consent states and interactions. That makes it the correct evidence for whether an origin or URL is passing Core Web Vitals.
Field data is a rolling historical view and may be unavailable at URL level when a page lacks sufficient eligible traffic. Origin-level data is useful when URL data is absent, but it must be labelled as origin data. Never paste an origin result beside one article and imply that the value was measured specifically for that article.
Lab data: a controlled diagnostic run
Lighthouse and Chrome DevTools reproduce a page load under documented conditions. They are excellent for identifying render-blocking resources, oversized images, late layout changes and long main-thread tasks. A lab run is not a sample of real visitors. Lighthouse also cannot measure INP without genuine interactions; Total Blocking Time is a lab diagnostic, not a replacement field value for INP.
A reproducible measurement protocol for media pages
Use the following protocol when testing an image converter, gallery, editor or media-heavy article. It is designed to make before-and-after results comparable.
- Define the page and build. Record the exact URL, date, deployment identifier, cache state and consent choice.
- Separate templates. Test the homepage, converter application and article template independently. A result from one template does not describe the others.
- Record field evidence first. Save URL-level and origin-level CrUX values when available, including whether the dataset is mobile or desktop.
- Run a controlled lab series. Use the same browser version, viewport, network/CPU settings and geographic test location. Run at least five times and report the median; retain individual runs.
- Inspect the metric element or interaction. Record the actual LCP element, every layout-shift source and the interaction associated with a slow INP or long task.
- Test a media workflow separately. If testing conversion, document the input image, dimensions, file size, animation state and number of files. Do not merge conversion duration into an LCP value.
- Change one material variable. For example, resize the LCP image or move conversion work off the main thread. Avoid deploying multiple unrelated changes when attribution matters.
- Repeat and wait for field confirmation. Lab improvements can be verified immediately; field distributions require new real-user data.
Minimum result record
Keep: URL, UTC timestamp, browser and version, device/viewport, test tool version, test location, cache state, consent state, run number, LCP and its element, CLS and its sources, TBT or interaction trace, response timings, and screenshots or trace files. If a value is unavailable, write “not available” instead of substituting an unrelated metric.
Diagnosing LCP on image-heavy pages
An image, video poster, background image or text block can be the LCP element. On media pages, the obvious suspect is often the hero image, but it should be confirmed in the trace. Google’s LCP guidance separates the delay into server response, resource discovery, resource download and render delay. That decomposition is more useful than simply replacing JPEG with WebP and hoping the score improves.
- Make the LCP resource discoverable in the initial HTML. A hero injected late by JavaScript begins its request late.
- Do not lazy-load the LCP image. Lazy loading is for off-screen media.
- Use an appropriately sized source and responsive image markup. Transferring pixels that will never be displayed wastes time.
- Consider
fetchpriority="high"for the confirmed LCP image, not for every image. - Reduce time to first byte and render-blocking work. A smaller image cannot compensate for a slow document response or a long render delay.
- Reserve width and height so the same optimization does not create a CLS regression.
WebP can produce smaller files than older formats in many controlled comparisons, but no honest percentage applies to every image and encoder setting. Content type, dimensions, quality, metadata and encoder options all matter. Measure the candidate asset rather than publishing a universal reduction rule.
Diagnosing INP in a browser-based image tool
INP covers the delay from a user interaction until the browser presents the next frame. In a client-side converter, image decode, canvas drawing, encoding and ZIP generation can compete with input handling when they occupy the main thread. A conversion may be computationally correct yet still feel unresponsive if the interface cannot paint progress, cancel work or acknowledge a click.
- Profile the exact interaction: selecting files, pressing Convert, opening a preview or downloading a batch.
- Break long work into smaller tasks so the browser can process input and paint updates.
- Move suitable work to Web Workers when the APIs and data-transfer costs make that worthwhile.
- Avoid decoding an entire batch concurrently on memory-constrained devices.
- Update progress indicators at a controlled cadence; excessive DOM updates can become work of their own.
- Release temporary resources—such as object URLs and closable bitmap objects—when they are no longer needed.
A fast conversion timer is not proof of good INP. Conversely, a slow total batch can still remain responsive if the UI acknowledges interactions and yields between jobs. Measure both dimensions, but report them separately.
Diagnosing CLS around previews, progress and ads
CLS is especially relevant when image previews, validation messages, progress rows or advertising slots appear after the initial layout. Google lists images without dimensions, dynamically injected content, embeds, ads and fonts among common causes of layout shifts.
- Give images explicit intrinsic dimensions and use CSS
aspect-ratiowhere appropriate. - Reserve a stable area for previews before a file is selected.
- Update progress inside an existing container instead of inserting content above the active control.
- Reserve realistic ad-slot dimensions and avoid collapsing then expanding the slot.
- Place errors beside their related field, or reserve message space, rather than pushing the entire tool downward.
- Check mobile widths: text wrapping can turn a stable desktop component into a shifting mobile component.
How WEBP to PNG Tools behaves
On WEBP to PNG Tools, visitors can select up to 20 WebP files per batch, with a maximum of 50 MB per file. Image conversion runs locally in the browser; the selected image files are not sent to a conversion server. The page itself can still make ordinary web requests, including requests associated with site delivery, analytics or advertising, as described in the site policies.
For animated WebP, the standard conversion produces the first frame. Where the browser supports the required frame-extraction path, the tool can export all frames as PNG files in a ZIP archive. Animation workloads should be tested separately because frame count can change CPU time and memory use substantially.
What our published benchmark can—and cannot—tell you
Our reproducible WebP-to-PNG benchmark contains 80 synthetic source images, 320 WebP encodings, raw case data, timing trials, environment details, code and checksums. It verifies properties of a documented Pillow/libwebp reference pipeline and shows how conversion output varies by content and encoding mode.
It is not a Core Web Vitals test. Its inputs were preloaded into memory, and its timings exclude the browser UI, network, page load and user interaction. It must not be cited as evidence that this website has a particular LCP or INP, or that one browser is faster than another. That boundary is part of the benchmark methodology, not a caveat to hide.
A practical optimization order
- Find which pages and device class fail in field data.
- Identify the actual LCP element, slow interaction or shift source.
- Fix document response and critical rendering before polishing minor asset savings.
- Keep client-side processing responsive by controlling concurrency and long tasks.
- Reserve layout space for media, results, consent UI and ads.
- Validate the change in a repeatable lab series.
- Confirm the distribution in new field data; do not declare victory from one green screenshot.
Frequently asked questions
Does converting WebP to PNG improve Core Web Vitals?
Not inherently. Core Web Vitals describe page loading, responsiveness and stability. PNG is useful when a workflow specifically requires PNG, but it often produces more bytes than the WebP input. If the exported PNG is then served as a page image, measure that asset in its real delivery context. Do not assume that a format conversion is a performance optimization.
Can a local conversion affect INP even if no file is uploaded?
Yes. Network transfer and main-thread responsiveness are separate concerns. Local decode, canvas, encoding or ZIP work can delay visual feedback if it creates long main-thread tasks. Inspect the actual conversion interaction in field telemetry or a performance trace.
Is one PageSpeed Insights score enough?
No. Preserve several comparable laboratory runs and report a defined summary such as the median. Then use field data to understand real visitors. A single lab run is valuable for diagnosis, but normal variation makes it weak evidence for a small before-and-after claim.
Should every image be lazy-loaded?
No. Off-screen images are candidates for lazy loading. The confirmed LCP image should normally be discoverable and requested promptly. Applying loading="lazy" indiscriminately can delay the most important visible media.
Methodology and limitations
This guide was rebuilt on 13 August 2026 using current Google, web.dev and web-platform documentation. It intentionally contains no invented PageSpeed, CrUX, Search Console or conversion results. Thresholds can be stated from the official definitions; a site-specific result requires a recorded measurement. CrUX availability varies with traffic and eligibility, laboratory results vary with environment, and browser-based media workloads vary with image dimensions, content, animation, device resources and browser implementation.
Sources and verification ledger
- web.dev: How Core Web Vitals thresholds were defined — current metrics, thresholds and p75 interpretation.
- web.dev: Web Vitals — stable metric set, field-versus-lab tools and INP measurement limits.
- web.dev: Optimize LCP — LCP decomposition and resource-discovery guidance.
- web.dev: Optimize CLS — common layout-shift sources.
- Google Search Central: Page experience — relationship between page experience, relevance and Search.
- MDN: ImageBitmap — closable bitmap resources and worker availability.
- W3C File API — selected files, blobs and object-URL lifecycle.